New Hampshire’s poverty rate of 9.2 percent was the lowest in the nation in 2014. While that distinction should inspire some pride, it should not engender complacency, for, as a means of assessing economic security, official federal poverty statistics often come up short. Indeed, economists and other analysts have long understood that the federal poverty threshold does not accurately reflect the level of income required to secure basic necessities, particularly in a state like New Hampshire, where the cost of living tends to be higher than in many other parts of the country.
Research by the Economic Policy Institute has produced a more robust measure of need, referred to as a “Basic Family Budget,” that more fully captures the cost of acquiring essential goods and services, from housing and health care to clothing and child care. In some instances, depending upon a family’s size and place of residence, their Basic Family Budget is three times as great as the federal poverty threshold, underscoring that many Granite State families, while not poor by official statistics, still struggle each day to make ends meet.
This Issue Brief describes the federal poverty threshold, examines some of its shortcomings, and explains the notion of using the Basic Family Budget calculation as an alternative measure of need. It also attempts to assess the degree to which various jobs in New Hampshire pay wages that are high enough to allow Granite State families to meet their basic needs.
Official Federal Measure Shows Poverty Low but Rising in New Hampshire
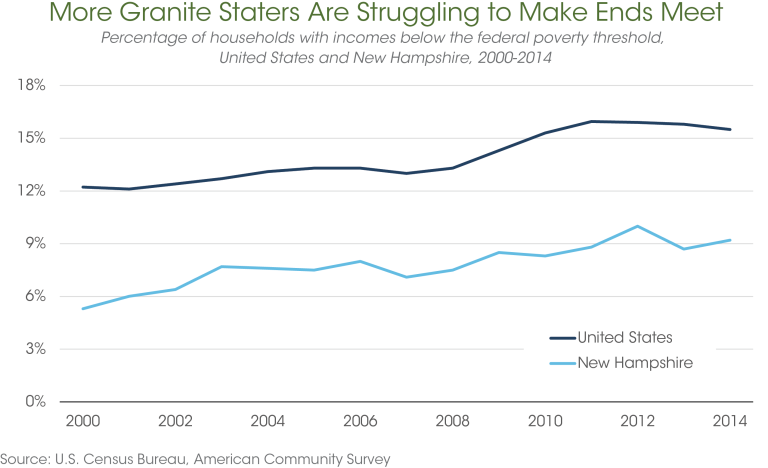
In 2014, 118,000 New Hampshire residents lived in families with incomes below the official federal poverty threshold, according to estimates from the US Census Bureau.[i] This number amounts to 9.2 percent of New Hampshire’s population, the lowest share of any state’s population to be considered poor. However, the issue of Granite Staters not earning enough for basic needs has steadily become more pervasive, with the number of New Hampshire residents living in material deprivation in 2014 almost twice what it was in 2000. Consequently, as the graph below depicts, the share of Granite Staters living in poverty remains considerably above the 5.3 percent rate that held at the turn of the century.
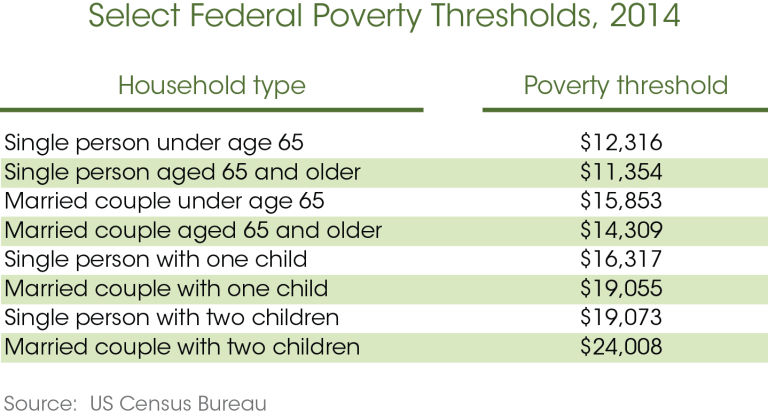
Each year the Census Bureau publishes figures by family type that are known as poverty thresholds. Essentially, if a family’s income is less than the dollar amount of the threshold for its household type, all the members of that household are considered to be living in poverty. Below is a subset of the official federal poverty thresholds for 2014.
When the federal poverty threshold was created in the 1960s, research on household consumption patterns revealed that a family of three or more spent about one-third of its budget on food. Consequently, the official poverty thresholds were created by multiplying the cost of a minimum food diet by three. The only adjustments to those original figures that have been made over time are to account for the general increase in all consumer prices, better known as inflation.
Shortcomings of the Federal Poverty Threshold
Given this information, the federal poverty thresholds suggest that a single person who earns $1,050 per month does not live in poverty. The same holds for a married couple with one child who earns $1,600 per month. Nevertheless, given the costs people face today, these numbers instinctively feel inadequate, an intuition that is borne out when one examines existing data on household expenditures. According to the US Department of Housing and Urban Development, a modest efficiency apartment in New Hampshire for a single person has a price tag of around $750 per month.[ii] For a family of three, a two-bedroom apartment costs nearly $1,100 per month. Based on these costs, shelter would constitute two-thirds of a poverty-level budget for each household, leaving little room to purchase food, clothing, health care, and transportation.
These examples demonstrate that the federal poverty threshold may not accurately capture the degree of economic insecurity individuals and families face. Supporting this conclusion, the Census Bureau concedes that the poverty thresholds are “…a statistical yardstick, not a complete description of what people need to live.”[iii] One weakness of the federal poverty threshold is the assumption that households spend one-third of their budgets on food; current data show that number is closer to 12 to 13 percent.[iv] Additionally, the federal poverty threshold does not account for geographic differences in housing and other costs, treating disparate places like New York City and Jackson, Mississippi equivalently. Lastly, the official measure defines “family resources” only as cash income, such as wages, Social Security benefits, and investment income. It does not add to a family’s resources non-cash governmental benefits (for example, SNAP or housing subsidies) or tax credits like the Earned Income Tax Credit. It also does not subtract from a family’s resources such necessary expenses as out-of-pocket medical expenditures or commuting costs.
In response to these shortcomings, Congress requested that the National Academy of Sciences convene a panel to examine the federal poverty threshold in greater depth. That panel produced a report in 1995 with a number of recommendations, which eventually led the Census Bureau to create what is called the supplemental poverty measure.[v] This method did not replace the official measure, but rather exists to provide alternative figures for comparison purposes. Unlike the official poverty threshold, the supplemental measure uses current data on household expenditures to approximate what it takes to purchase basic necessities, such as food, clothing, shelter, and utilities. Moreover, the supplemental poverty measure accounts for geographic differences in housing costs, meaning that its dollar thresholds vary from state to state, whereas the official poverty thresholds are identical for the 48 contiguous states. Finally, the supplemental measure adds non-cash governmental benefits and federal tax credits to a household’s income and subtracts out necessary expenses in order to capture the resources available to a household.
As of 2014, for twenty-six states, the poverty rate under the supplemental measure was lower than the official rate, meaning that the official measure is overstating poverty.[vi] In eleven states, no statistically significant difference was found between the two measures. In thirteen states, including New Hampshire, the supplemental measure found more people living in poverty. Looking more closely at this final pool of states, two patterns emerge. First, most of these places, such as California, Alaska, Hawaii, and the Northeast region, have above-average housing costs, which is not captured by the official poverty measure. Second, the populations of the Northeast and Florida are older than the rest of the country. This is germane because the supplemental measure deducts insurance premiums and out-of-pocket medical expenses (such as co-pays for prescriptions or doctor’s visits) from available financial resources. Because this category of expenses tends to be significant for older people, subtracting them results in an increase in measured poverty for those 65 years old and over.[vii]
Basic Family Budgets: A Better Measure of Need
While the supplemental poverty measure is a meaningful improvement over the official method, it has its own limitations. First, with the exception of housing, the supplemental measure does not reflect geographic variability in its estimates of costs that households encounter every day. Second, the supplemental measure only provides information “at the national level or within large subpopulations,” meaning that it does not capture differences within states.[viii] Finally, child care costs are not adequately measured. Rather than surveying child care providers to approximate market-based rates, the supplemental measure uses information from working parents on what they spend on child care. This distinction is important since many low-income families who are unable to afford market rates have to rely on alternatives for care, such as a relative or neighbor.
Given the supplemental measure’s constraints, researchers have attempted to construct more robust standards of need that reflect what it takes to achieve economic security and independence. One such effort is the Family Budget Calculator compiled by analysts at the Economic Policy Institute (EPI), a nonpartisan think-tank based in Washington, DC.[ix] Their objective is to estimate the “income necessary for families to secure an adequate but modest living.” To achieve this, they identify the most basic expenses households incur: housing, food, transportation, health care, child care (if applicable), taxes, and other necessities (such as clothing). From there, they price each expense as locally as possible for ten different family types, ranging from one adult with no children to two adults with four children.[x] These Basic Family Budget calculations are done for sub-state regions within all 50 states.
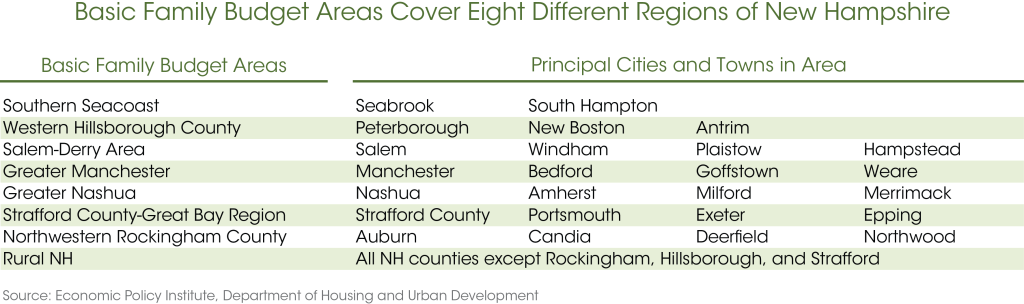
Driven mostly by geographic definitions from the Department of Housing and Urban Development, under EPI’s analysis, New Hampshire is divided into eight geographic areas. Each is shown below along with a sample of towns, cities, and counties within each area.[xi]
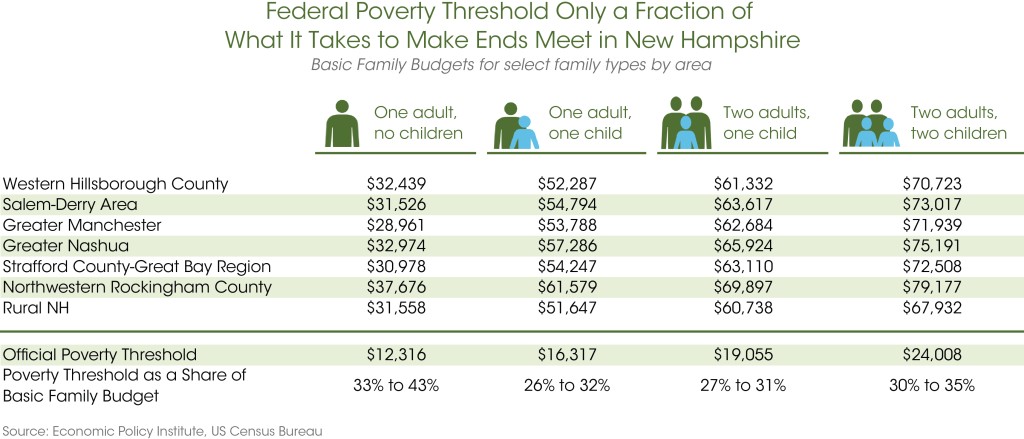
In the following table, annual budgets for four family types are shown for each area of New Hampshire, along with the official poverty thresholds as a percentage of EPI’s Basic Family Budget. What is evident is that the federal poverty threshold is far beneath the income necessary for any family to attain an adequate living standard in the Granite State.
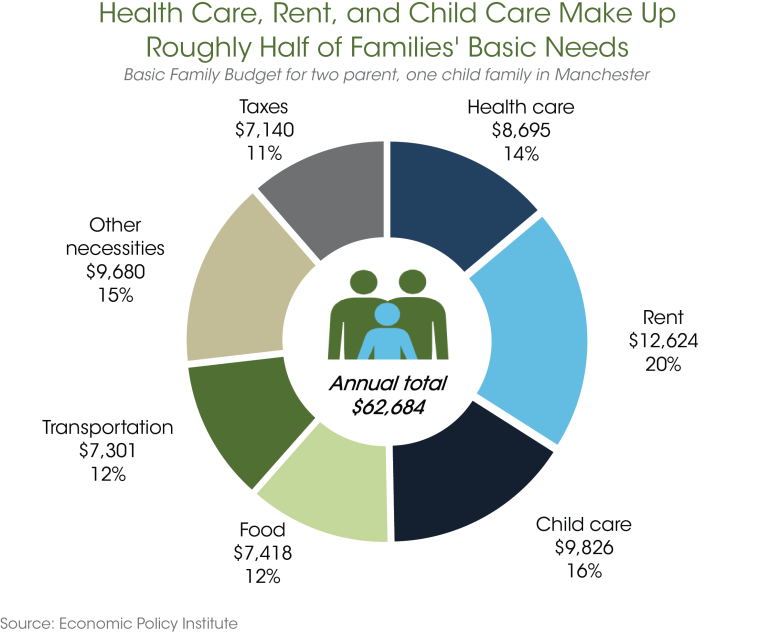
A closer examination of EPI’s research reveals that health care, rent, and child care (for families with children) are the largest costs households face, rather than food, as assumed by the official poverty thresholds. For instance, the figure below shows a Basic Family Budget for a two adult, one child family in Manchester, the state’s largest city. As it illustrates, health care costs constitute 14 percent of their budget, rent comprises 20 percent, and child care makes up 16 percent.
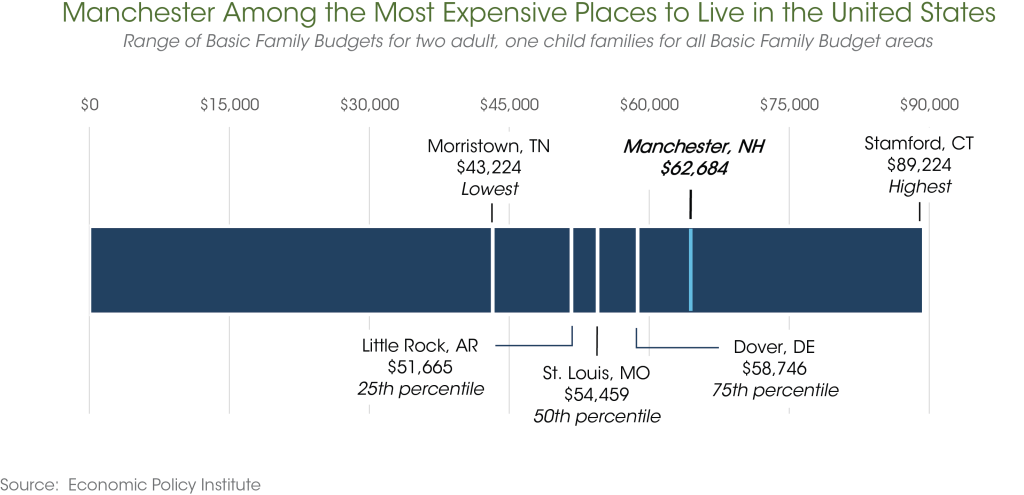
In addition to varying by family type, the costs of many basic necessities vary by geography, and, as noted above, those costs are often higher in the northeastern part of the United States. The table below provides a helpful depiction of such variation. Again, EPI estimates that a two adult, one child family in Greater Manchester needs an annual income of nearly $63,000 to secure a modest standard of living, a figure that ranks in the top fifth of the 618 family budget areas analyzed by EPI. In other words, for a two adult, one child family, Greater Manchester is a more expensive place to live than 80 percent of US communities, outpacing such cities as Little Rock and St. Louis. Greater Manchester’s comparatively high ranking is primarily due to higher costs for housing and child care. More specifically, at $12,624 per year, housing costs for a two adult, one child family in Greater Manchester are among the top quarter of areas examined by EPI. Likewise, annual child care costs of $9,826 for a two adult, one child family in Greater Manchester are roughly 10 percent higher than child care costs in Pittsburgh, which represented the 75th percentile of such costs in EPI’s analysis.
Many Jobs in New Hampshire Leave Workers Unable to Achieve an Adequate Standard of Living
While estimates of the number and share of New Hampshire households with incomes below the federal poverty threshold are produced by the Census Bureau each year, comparable figures for the degree to which Granite Staters are unable to meet their Basic Family Budgets are not yet available. Nevertheless, NHFPI has attempted, based on state occupational data, to approximate how many jobs in New Hampshire pay wages that are high enough to allow Granite State families to meet their Basic Family Budget.
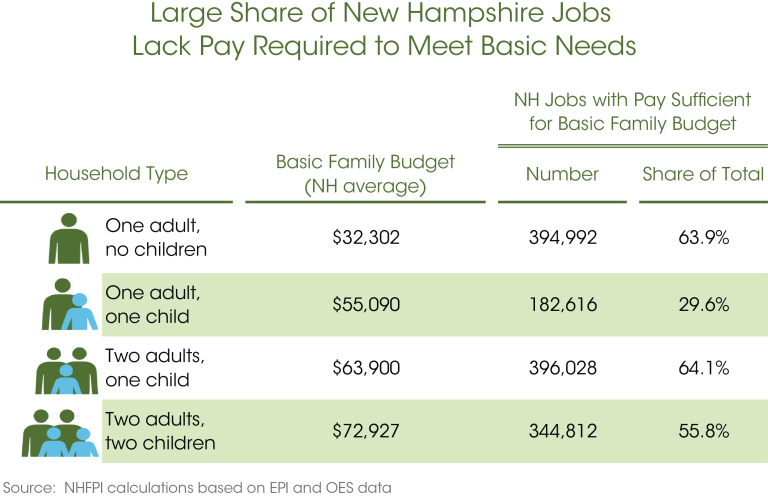
As explained in greater detail in the methodology section following the conclusion of this Issue Brief, NHFPI examined data from the Occupational Employment Statistics (OES) survey on the distribution of wages paid in each of 603 different occupations in New Hampshire. It then compared those wages to Basic Family Budgets for four key family types, and, using several simplifying assumptions, arrived at an estimate of the number of jobs in New Hampshire that pay above or below those budgets. Accordingly, as summarized in the table above, NHFPI finds that:
- Roughly 64 percent of New Hampshire jobs pay enough for a single, childless adult to attain an adequate standard of living, as measured by EPI’s Basic Family Budget.
- Only about 30 percent of New Hampshire jobs pay enough for a single parent with one child to attain an adequate standard of living.
- Approximately 64 percent of New Hampshire jobs pay enough for two working adults with one child to attain an adequate standard of living.
- Roughly 56 percent of New Hampshire jobs pay enough for two working adults with two children to attain an adequate standard of living.
A review of the overall distribution of wages among all New Hampshire occupations provides a rough corroboration of these findings. In particular, according to the OES survey, 25 percent of all occupations pay $24,230 or less, 50 percent pay $36,420 or less, and 75 percent pay $56,800 or less. In turn, Basic Family Budgets for a single parent with one child range from about $51,600 to $61,600 – that is, ranging from just below to slightly above the 75th percentile wage. In comparison, NHFPI estimates that nearly 70 percent of occupations do not pay enough for a single parent with one child to make ends meet. Similarly, Basic Family Budgets for a single, childless adult range from $28,900 to $37,700, a span squarely above the 25th percentile wage but generally below the 50th percentile mark, largely consistent with NHFPI’s finding that about 36 percent of occupations pay less than the level needed for a single person to achieve an adequate standard of living.
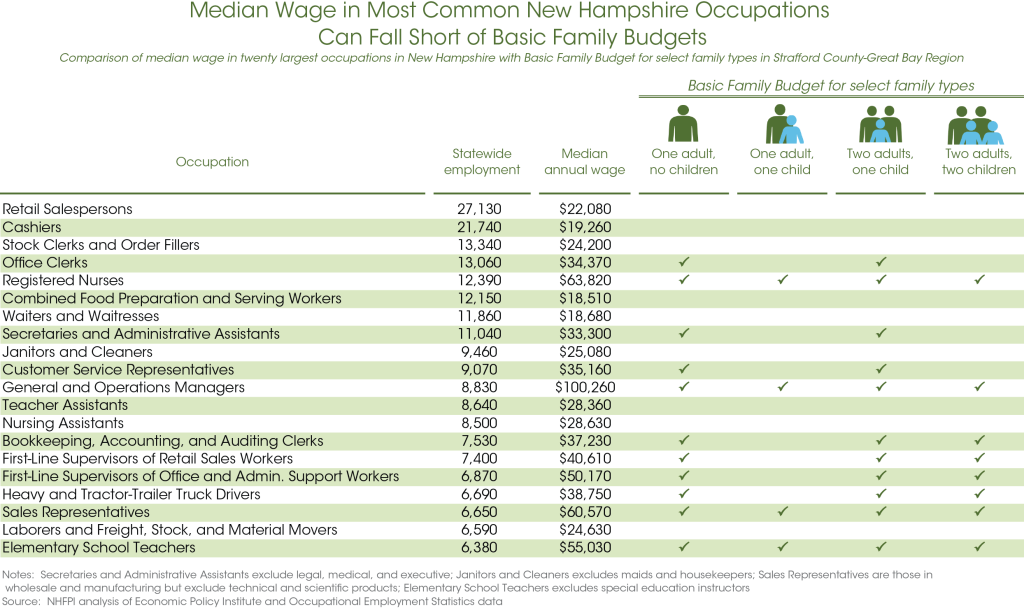
To illustrate further the general finding that many jobs in New Hampshire do not pay enough for families and individuals to achieve an adequate standard of living, the table below compares the Basic Family Budget for the Strafford County-Great Bay Region for four main family types with the median wage for the 20 most common occupations in New Hampshire. Check marks (P) indicate scenarios in which a particular median wage equals or exceeds the Basic Family Budget for that family type. So, for instance, retail salespersons constitute the most numerous occupation in New Hampshire; the most recent data show that the median annual wage for such a job is $22,080.[xii] That wage, in turn, is insufficient to meet the Basic Family Budget for each of the four main family types in the Strafford County-Great Bay Region. Alternatively, there are 12,390 registered nurses in New Hampshire. Their median annual wage is $63,820, a level of pay that exceeds those four Basic Family Budgets.
Such comparisons should not, of course, be taken as definitive. Median wages simply convey the “typical” wage for that occupation; there can be significant variation in wages even within a single occupation. Consequently, some workers in an occupation with a comparatively low median wage may still be able to reach their Basic Family Budget. In addition, the table above is obviously not a comprehensive catalogue of the types of employment available in New Hampshire. High wage and low wage occupations alike are left out of this listing, along with the prospect of out-of-state employment. Nevertheless, such comparisons do help to highlight the mismatch between the wages many workers earn and the costs they face for putting food on the table and a roof over their heads.
Conclusion
Whether in the private sector or in the public sphere, statistics can have great value, but they can also fail to depict completely the situations or trends they are intended to illustrate. New Hampshire’s comparatively low poverty rate is an excellent case in point, as it stands at odds with the economic anxiety many Granite State families continue to experience. A more robust assessment of basic needs, as embodied in the Economic Policy Institute’s Basic Family Budget calculation, offers a clearer understanding of how much further working families must go in the Granite State just to get by. In the years ahead, the task before policymakers will be to identify and to implement a combination of reforms to help people make ends meet, both by bolstering incomes and by bringing the costs of basic necessities within closer reach.
Methodology
In its efforts to arrive at a preliminary estimate of the number of jobs that fail to provide wages sufficient to meet Basic Family Budgets, NHFPI utilized data from the Occupational Employment Statistics (OES) survey.[xiii] This survey is conducted in every state by state employment security agencies and obtains information from employers through voluntary mail questionnaires. Each employer is asked to provide the number of employees within their company by occupation and wage paid. Wage estimates in the OES survey represent wages and salaries only and do not include bonuses or nonwage benefits like health insurance or retirement contributions. The OES survey covers all full-time and part-time wage and salary workers in nonfarm industries. The survey does not cover the self-employed, owners and partners in unincorporated firms, household workers, or unpaid family workers.
Before calculating its estimates, NHFPI transformed the original data by removing any occupation that did not have an employment estimate or a wage estimate for all five of the percentiles (10th, 25th, 50th, 75th, and 90th) in the OES’ calculated wage distribution. This resulted in the exclusion of only approximately 10,000 out of 627,000 jobs from the analysis.
In terms of occupational groupings, NHFPI examined detailed occupations rather than major occupations. For example, rather than assessing management occupations in the aggregate (Occupational Code: 11-0000), NHFPI analyzed data on all of the occupations grouped into management, from chief executives (Occupational Code: 11-1011) to sales managers (Occupational Code: 11-2022) to food service managers (Occupational Code: 11-9051).
In calculating its estimates, NHFPI made the following assumptions:
- If an occupation’s 10th percentile wage is above the Basic Family Budget dollar amount, then all jobs within that occupation are deemed to earn enough to secure an adequate standard of living.
- If an occupation’s 10th percentile wage is below the Basic Family Budget dollar amount, but its 25th percentile wage is above, then 90 percent of jobs within that occupation are deemed to earn enough to secure an adequate standard of living.
- If an occupation’s 25th percentile wage is below the Basic Family Budget dollar amount, but its 50th percentile wage is above, then 75 percent of jobs within that occupation are deemed to earn enough to secure an adequate standard of living.
- If an occupation’s 50th percentile wage is below the Basic Family Budget dollar amount, but its 75th percentile wage is above, then 50 percent of jobs within that occupation are deemed to earn enough to secure an adequate standard of living.
- If an occupation’s 75th percentile wage is below the Basic Family Budget dollar amount, but its 90th percentile wage is above, then 25 percent of jobs within that occupation are deemed to earn enough to secure an adequate standard of living.
- If an occupation’s 90th percentile wage is below the Basic Family Budget dollar amount, then zero jobs within that occupation are deemed to earn enough to secure an adequate standard of living.
In making these comparisons, NHFPI used a Basic Family Budget for each family type that represents the average of the eight geographic regions included in EPI’s analysis.
To help better understand these assumptions, several examples may be helpful. The following table, which represents a small subset of the data, provides an estimate of how many people are employed in an occupation along with wage estimates at various percentiles. For context, a percentile wage estimate is the wage value beneath which a percentage of workers fall. For example, the 75th percentile annual wage for “construction laborers” is $37,890, meaning 75 percent of people in that occupation earn less than that dollar amount.
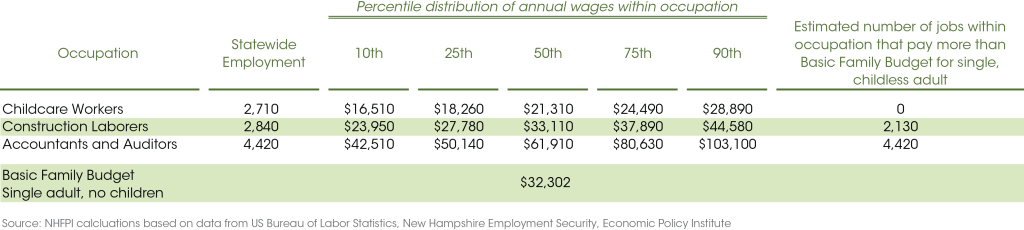
As shown above, the 10th percentile annual wage for “Accountants and Auditors” is $42,510. Consequently, NHFPI assumed all 4,420 jobs within that occupation paid at or above the average Basic Family Budget of $32,302 for a single childless adult.
At the opposite end of the spectrum, if an occupation’s 90th percentile wage was less than the Basic Family Budget, then no jobs were presumed to produce an adequate income for that family type. Looking at “Childcare Workers”, the data indicate that the 90th percentile annual wage is $28,890. Accordingly, all 2,710 jobs within that occupation were deemed insufficient to make ends meet for a single, childless adult.
The third and final example involves situations in which earnings in an occupation are adequate for some workers, but not for every worker. The 50th percentile (median) annual wage for “Construction Laborers” is $33,110, which means that at least half of the jobs within this occupation earn enough for a single, childless adult to meet his or her average Basic Family Budget. Yet, the 25th percentile wage is $27,780, meaning that the bottom 25 percent of jobs do not pay a sufficient amount. Under such circumstances, NHFPI assumed that all workers who earn between the 25th percentile and the 50th percentile make more than the Basic Family Budget. Hence, for a single, childless adult, we conclude that three-quarters of “Construction Laborers” jobs earn more than what is needed for an adequate living standard.
This methodology is by no means the only approach that could have been used in attempting to understand how many Granite Staters are able to make ends meet. NHFPI hopes to refine its estimates further in the future through the use of the American Community Survey’s Public Use Microdata Sample, which includes far more detailed information on incomes for different family types in various parts of the state.
Endnotes
[i] Executed by the US Census Bureau, the American Community Survey (ACS) provides estimates of income and poverty for states, in addition to smaller geographic units like metropolitan areas and counties. The survey is recognized as one of the best tools to provide statistical portraits of our nation’s communities, yet since it is a survey and does not gather information about every resident, there is a level of uncertainty or margin of error. For example, the number of Granite Staters in poverty was estimated to be 117,983 in 2014, with a margin of error of 7,687. What this means is that, while the precise number of residents in poverty is unknown, we can say with a good deal of statistical confidence that it is likely between 110,000 and 125,000 people.
[ii] http://www.huduser.gov/portal/datasets/fmr.html
[iii] http://www.census.gov/hhes/www/poverty/about/overview/measure.html
[iv] http://www.bls.gov/cex/2014/combined/age.pdf
[v] http://www.census.gov/hhes/povmeas/methodology/supplemental/overview.html
[vi] http://www.nhfpi.org/wp-content/uploads/2014/10/Poverty-Higher-in-New-Hampshire-Under-More-Comprehensive-Measure.png
[vii] https://www.socialsecurity.gov/policy/docs/ssb/v73n4/v73n4p49.html
[viii]http://www.census.gov/hhes/povmeas/methodology/supplemental/research/SPM_TWGObservations.pdf
[ix] http://www.epi.org/publication/what-families-need-to-get-by-epis-2015-family-budget-calculator/
[x] A budget is calculated for ten family types in over 600 geographic areas. Of these areas, 48 are statewide averages of rural areas. The remaining correspond to fair market rent (FMR) areas as outlined by the Department of Housing and Urban Development (HUD). Data for certain budget components are not available by FMR. For example, US Department of Agriculture data on family food costs are only available at the national level. For child care expenses, data is only available at the state level. Also, EPI assumes that both parents in a two-parent family work. For more information, please refer to http://www.epi.org/publication/family-budget-calculator-technical-documentation/
[xi] The names NHFPI has assigned to the geographies included in EPI’s analysis differ from those used by EPI, which in turn draw from the fair market rent (FMR) areas devised by the US Department of Housing and Urban Development (HUD). More specifically, the eight descriptors found in EPI’s analysis are as follows: Boston-Cambridge-Quincy, MA-NH; Hillsborough County, NH (part); Lawrence, MA-NH; Manchester, NH; Nashua, NH; Portsmouth-Rochester, NH; Rural NH; and Western Rockingham, NH. In an effort to provide improved local context, NHFPI refers instead to those areas, respectively as: Southern Seacoast; Western Hillsborough County; Salem-Derry Area; Greater Manchester; Greater Nashua; Strafford County-Great Bay Region; Rural NH; and Northwestern Rockingham County. Finally, the Southern Seacoast region noted here is actually a very small part of the much larger Boston metropolitan area under HUD’s FMR classifications and is not representative of a significant portion of New Hampshire households. Accordingly, NHFPI has excluded it from any further analysis in this report.
[xii] The OES survey is designed to produce estimates by combining data collected over a three-year period. The most recent data, which are used here, are for the 2012-2014 period.
[xiii] The data for this analysis were downloaded from http://www.bls.gov/oes/#data. Additional details on the OES survey can be found at http://www.bls.gov/oes/oes_ques.htm#overview and
http://www.nhes.nh.gov/elmi/products/documents/wages-all.pdf.