In its present state, the New Hampshire economy offers a number of encouraging signs. Both employment – the total number of people working in the Granite State – and economic output – the value of the goods and services those individuals produce – have been on the rise over the past several years. At the same time, the quality of New Hampshire’s workforce remains high, as its level of educational attainment continues to exceed that in most states, while the extent of severe economic hardship, as expressed by the state’s poverty rate, is still lower here than anywhere else.
Yet, the state of working New Hampshire – the circumstances faced by many individual workers and their families – is somewhat less favorable. As this Issue Brief details, New Hampshire’s workforce is aging in character and all but stagnating in size. Moreover, recent years have seen a continuation of a longer-term shift in the types of jobs available in the Granite State, with service sector employment – and the comparatively lower wages associated with it — becoming more prominent. Further, the income for the typical New Hampshire household, as well as hourly wages for much of the Granite State workforce, have yet to recover ground lost since the Great Recession. In fact, the median hourly wage in New Hampshire has dropped more sharply than nearly anywhere else over the last eight years.
New Hampshire’s Workforce Better Educated but Older than Most States
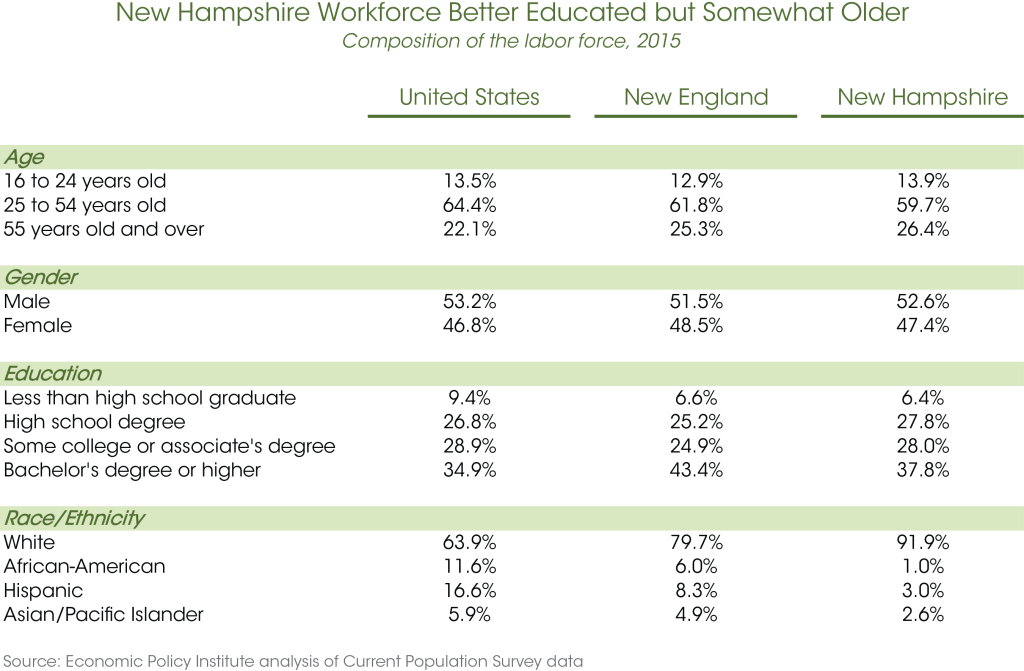
In 2015, approximately 741,000 New Hampshire residents were in the labor force, meaning they were either employed or unemployed and had actively sought work in the past month.[i] As the table below illustrates, compared to the rest of the nation, New Hampshire’s workforce is generally better educated, but also somewhat older. For example, nearly 38 percent of New Hampshire’s workforce had a bachelor’s degree or higher in 2015. This share ranks 10th highest across all states, which range in value from 49 percent in Massachusetts to 24 percent in Mississippi. Possessing a more educated workforce has been a feature of the Granite State’s economy for the past few decades, as the share of its workforce with a bachelor’s degree or higher has consistently been above the national average since 1990 and among the top third of states over that span.
While this attribute is undoubtedly a positive for New Hampshire, one trait that may prompt concern is the collective age profile of its workforce. More than one quarter of New Hampshire’s workforce – 26.4 percent – is age 55 and older; in 2015, only Maine and Vermont, at 29.8 percent and 28.8 percent respectively, had larger shares of their work forces fall into this age category. This, in turn, raises questions about the future growth of the workforce and whether there will be enough available workers to replace the upcoming stream of retirees.
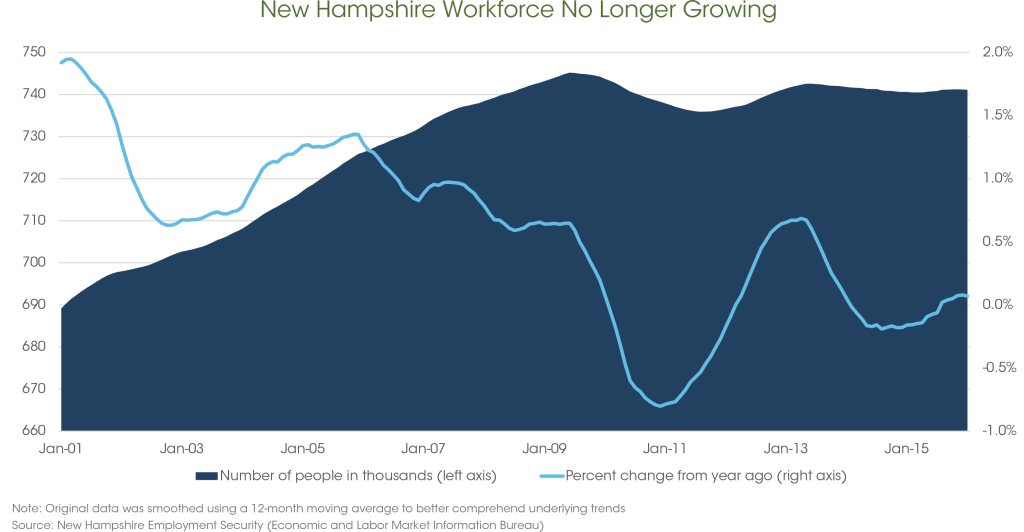
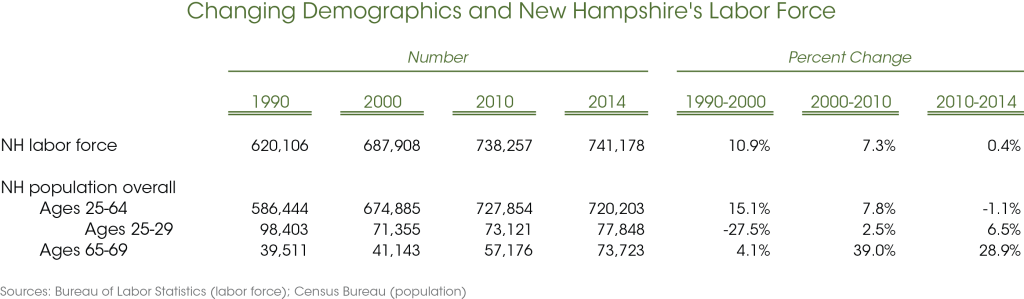
Indeed, over the past few years, New Hampshire’s labor force has grown at an anemic rate. As the following figures attest, during the 1990s and 2000s, the state’s labor force swelled considerably, reaching just over 738,000 by 2010. Between 2010 and 2014, however, it grew by just 0.4 percent or by fewer than 3,000 workers. This development is significant, since the labor force represents the potential pool of workers from which New Hampshire employers have to choose. If that pool is not growing, they might struggle to find workers to meet their demand, though this may not have inhibited employers immediately after the recession, since there was a significant number of people who were unemployed at the time. However, this is no longer the case and some New Hampshire businesses are now experiencing labor shortages.[ii],[iii] While this problem may be due to mismatches between the skills job applicants have and the skills employers need, the lack of labor force expansion is likely also at play.
One reason New Hampshire’s labor force has stopped expanding is that the state’s 25 to 64 year old population is declining, as more and more residents are reaching the age of retirement, while the number of people in their mid-20s has not kept pace. Since 2010, New Hampshire’s “prime working age” population has dropped 1.1 percent or by roughly 7,500 individuals. While the number of people aged 25 through 29 has risen somewhat since then – climbing 6.5 percent from about 73,100 to around 77,800 – the number of people aged 65 through 69 has continued to swell – jumping 28.9 percent between 2010 and 2014.
Employment Climbing, Shifting Toward Service Sector
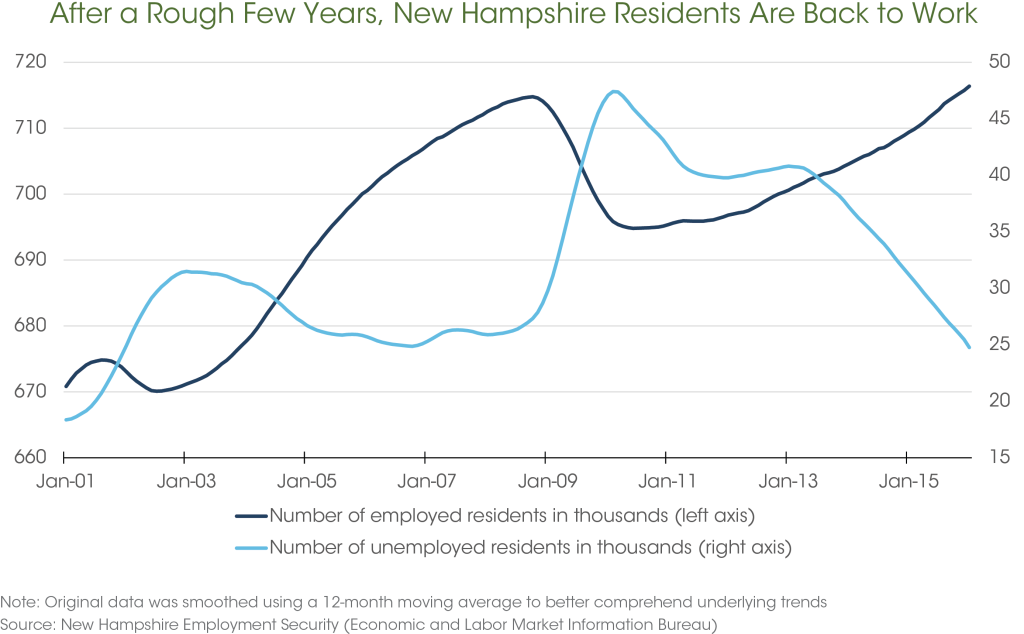
While the size of New Hampshire’s labor force has remained relatively steady in recent years, the mix of employed and unemployed workers has improved significantly. In the immediate aftermath of the Great Recession, which lasted from the end of 2007 through the middle of 2009, the number of unemployed Granite Staters residents exceeded 47,000, almost twice the amount at the start of the economic downturn. Today, that figure has returned to pre-recession levels; as of December 2015, the number of unemployed Granite Staters averaged 25,465 in the preceding twelve-month period, just below where it was in December of 2007. Conversely, the number of employed New Hampshire residents now exceeds its pre-recession peak. At the onset of the Great Recession, the number of employed Granite Staters was roughly 712,000; that measure has stayed consistently above that mark since June 2015.
With the number of unemployed Granite Staters falling considerably, it’s no surprise that the state’s unemployment rate has done the same, retreating from nearly 6.5 percent in early 2010 to around 3.0 percent in March of 2016. Nevertheless, due to shortcomings in the manner in which it is calculated, the unemployment rate may have limited utility as a means of assessing the state of the economy. That is, the official unemployment rate only counts someone as unemployed if they have looked for work in the past four weeks. As a result, it fails to capture workers who are either marginally attached to the labor force – those workers who have looked for a job in the past twelve months, but not in the last four weeks – or underemployed – workers who are employed part-time, but want, and are available for, full-time work.[iv] Accounting for these two sets of workers – in a broader measure favored by many analysts and known as the underemployment or U-6 rate – pushes unemployment in New Hampshire to closer to 8 percent, which is still an improvement over the 12.5 percent mark attained in 2009.[v]
Given the adverse consequences associated with unemployment, these trends are welcome news, but the fact that more residents are employed today than eight years ago says little about the quality of today’s jobs. As James Bullard, president of the Federal Reserve Bank of St. Louis, puts it:
Press accounts in recent years have echoed this concern, noting that, while the total number of jobs has returned to normal, many well-paying fields have contracted and lower-wage work has proliferated.[vii]
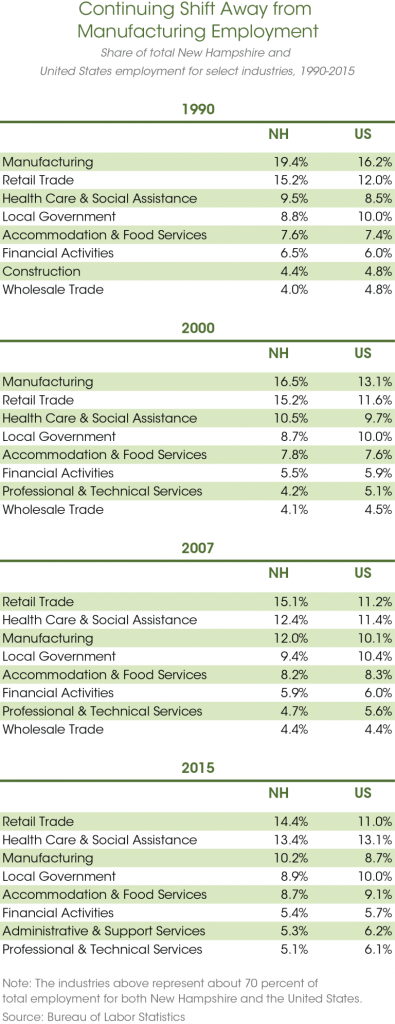
The table at above attempts to illustrate the degree to which this shift has occurred in New Hampshire, both over the past several decades and since the onset of the national recession in 2007. The decline in manufacturing, long a vital cog in the Granite State economy, is particularly marked. In 1990, the manufacturing industry was responsible for nearly one in five jobs, by far the largest sector in New Hampshire, with many such jobs paying above-average wages. At the start of the 21st century, the industry was still crucial, but its importance was beginning to wane, as was the case in most states. Indeed, by 2015, manufacturing accounted for just 10.2 percent of employment in New Hampshire, almost half the share it comprised 25 years ago.
In its place, the health care industry has emerged as a more significant economic force. In 1990, health care and social assistance employment comprised close to 10 percent of non-farm employment in New Hampshire, a figure that rose to 12.4 at the start of the recession and that has continued to climb – reaching 13.4 percent in 2015.
Lastly, the table at left underscores the importance of employment in retail trade, a traditionally low-wage industry, in New Hampshire. Since at least 1990, New Hampshire has had a greater concentration of retail employment than the national average and one of the highest concentrations among the fifty states throughout that period.
As wages can vary considerably among industries, this shift in the composition of employment can have significant ramifications for the New Hampshire workforce. The table below focuses more closely on the changes that occurred in the New Hampshire job market between 2007 and 2014.[viii] As it shows, over this time frame, high-paying industries such as manufacturing, construction, and wholesale trade saw their payrolls collectively shrink by 17,000. In exchange for those losses were 18,000 new jobs in four industries: (1) health care and social assistance, (2) administrative and support services, (3) accommodation and food services, and (4) professional and technical services.
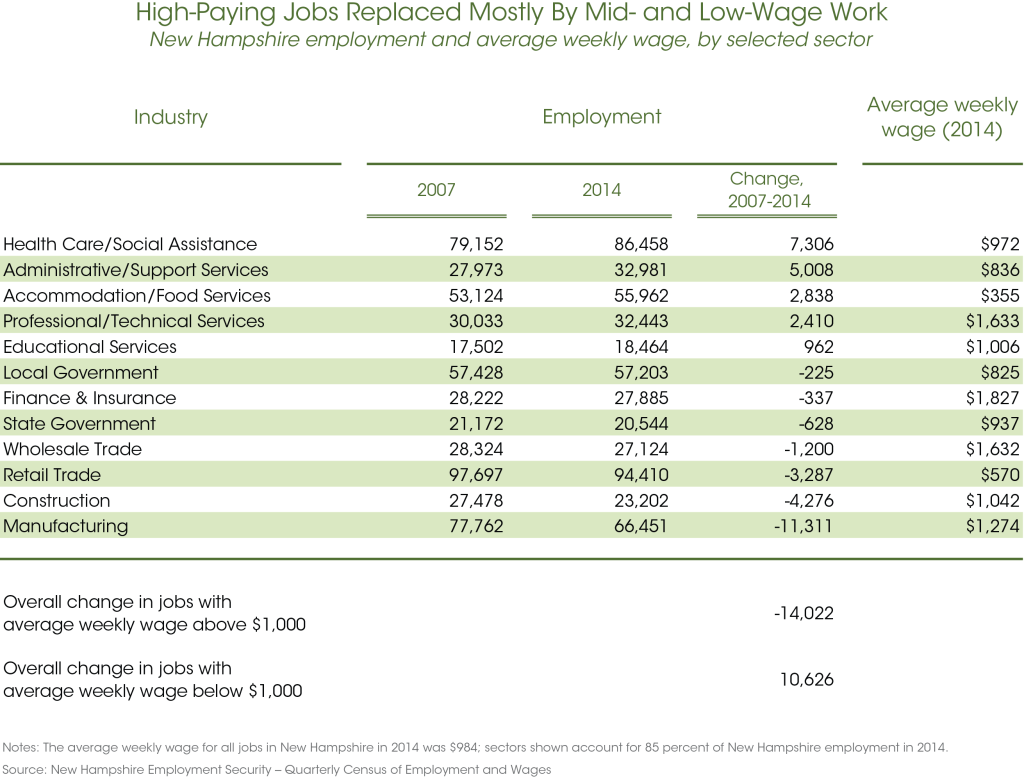
As the table further reveals, average weekly wages in the health care industry are near the overall state average of $984, while administrative and support service and accommodation and food service jobs fall noticeably below that mark. Thankfully, the state’s economy did gain over 2,000 professional and technical positions, which are among the highest-paying in the state, between 2007 and 2014. Nevertheless, there has been a shift toward industries that pay less than $1,000 per week on average. Overall, the number of jobs paying below that standard rose by about 10,600, while the positions paying above that level declined by more than 14,000 over the 2007-2014 period.
To be sure, this trend has not been limited to New Hampshire, as across the country there are 1.8 million fewer manufacturing jobs, 1.2 million fewer construction jobs, and 1.7 million more food service jobs today than prior to the Great Recession. Accordingly, preparing residents with the skills to meet the requirements of mid- and high-wage employment will be a priority everywhere. This is especially true for New Hampshire, given the persistently high concentration of jobs in the retail industry and the below-average concentration of jobs in the professional and technical services industry (which includes computer programmers, accountants, lawyers, and engineers).
Economic Output Expanding, but Incomes and Wages for Typical Granite Stater Still Yet to Recover from Recession
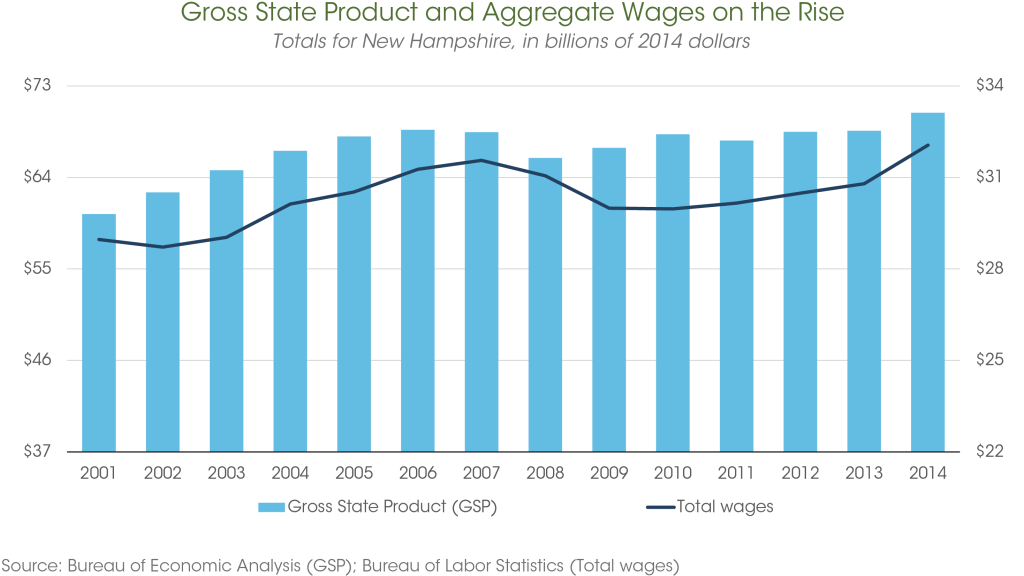
Just as the number of employed New Hampshire residents has grown in recent years and has returned to peak levels, so too has overall economic output. In the aggregate, Gross State Product (GSP) in New Hampshire – the monetary value of all goods and services produced by the state’s economy — amounted to $70.4 billion in 2014. As the figure below suggests, after accounting for inflation, that represents an increase of $1.9 billion or 2.8 percent over 2007. GSP is now $10 billion or 17 percent higher than what it was in 2001.[ix] Similarly, the aggregate amount of wages – defined here as wages plus bonuses, stock options, severance pay, profit distributions, cash value of meals and lodging, tips and gratuities, and in some instances, employers’ contributions to workers’ pension plans — has climbed as well. In 2014, total wages reached $32.1 billion, some $500 million more than what they were in 2007 after taking inflation into account.
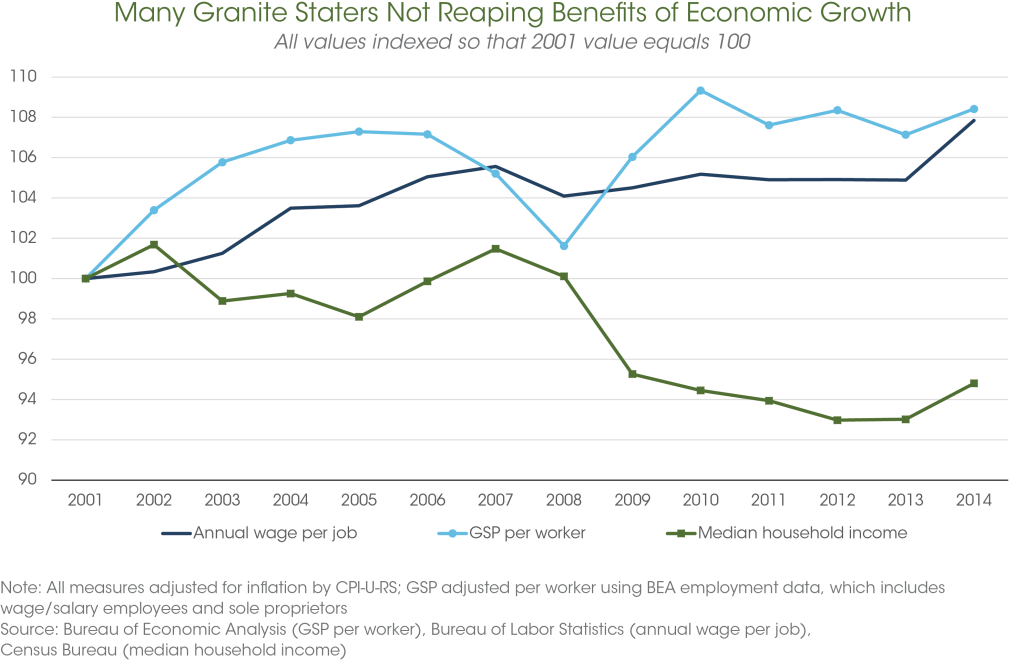
Of course, as noted previously, the size of the New Hampshire workforce has ebbed and flowed over the last 15 years. So, to account for those developments, the figure below presents GSP and aggregate wage data on a per worker or per job basis. More specifically, it shows that real (that is, inflation-adjusted) GSP per worker grew from $80,641 in 2007 to $83,096 in 2014, a difference of about 3.0 percent. Likewise, the annual amount of wages per job in New Hampshire rose from $50,084 in 2007 to $51,165 in 2014, an increase of 2.2 percent.
Nevertheless, while increases in output and aggregate wages are a positive sign, they may not be translating into improvements in well-being for all or even most New Hampshire workers. To understand why such apparent increases may not lead to a higher standard of living for the typical New Hampshire worker, it’s important to understand how these figures were derived. In computing its annual wage per job figure, the US Bureau of Labor Statistics calculated the average, simply dividing total annual wages by total employment. Similarly, to arrive at GSP per worker, the US Bureau of Economic Analysis performed the same arithmetic and divided GSP by the number of workers (including sole proprietors). Still, just because the average wage is $51,165 and has risen by 2.2 percent does not necessarily mean that the average worker is making $51,165 and capturing the prosperity of an expanding economy. Rather, that average assumes everyone gets an equal slice of the economic pie, which is not the case, and reveals little about who is earning how much of that expanding income. In fact, other research indicates that most of the recent gains in income have accrued to the highest earners in the state.[x] Mathematically, this would raise any average figure, such as annual wage per job or GSP per worker, without putting any more money in the pockets of most workers.
One way to better diagnose the situation is to rely upon the median rather than the average. The median of any data series is the observation that divides the distribution in half. For example, median household income in New Hampshire was $66,532 in 2014. This means that half of households had incomes below and half above that figure, which allows for a better read on how low- and moderate-income households are holding up financially. As the figure above shows, even as the economy has expanded following the Great Recession, the income for the typical New Hampshire household has declined, dropping 6.6 percent from its 2007 level, which amounted to $71,217, after accounting for inflation.
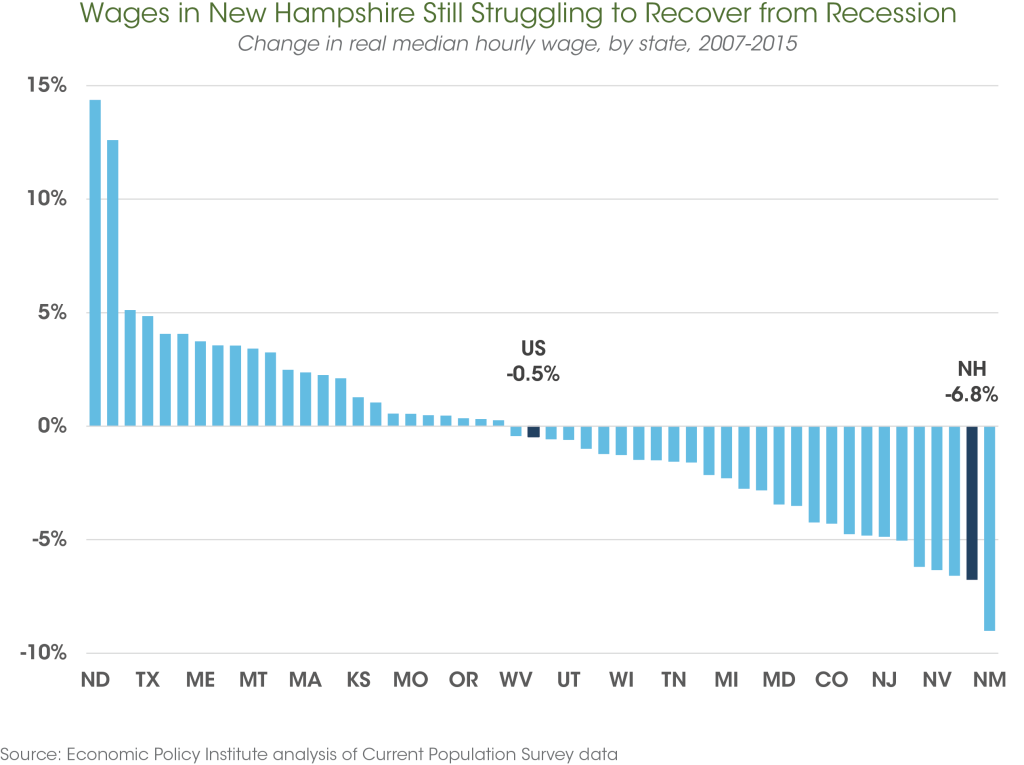
Though household incomes may come from multiple sources, wages paid by an employer are generally the single largest. Consequently, one factor that may help to explain the deterioration in median household income in New Hampshire is the unfavorable trend in hourly wages depicted in the figure below. Adjusted for inflation, the median hourly wage in New Hampshire fell nearly 7 percent between 2007 and 2015, declining from $19.51 to $18.19. To be sure, as the figure further reveals, most states saw a decline in their real median wage during this time period, due to the depth and breadth of one of the worst economic downturns in modern history. Additionally, at just over $18 per hour, New Hampshire has one of the highest median hourly wages in the country. Nevertheless, since the onset of the recession, only New Mexico has witnessed a steeper decline in its median hourly wage than New Hampshire.
The decline in New Hampshire’s median hourly wage since the recession can be seen among workers of different demographic attributes, too. For instance, both men and women saw a drop in their median hourly wages during this period, with the hourly wage for the typical male worker losing a little more than 3 percent of its real value between 2007 and 2015. For female workers, the decline was sharper still, as their median hourly wage went from $17.27 in 2007 to $16.28 in 2015, a 5.7 percent erosion or the next worst among women in all fifty states. Likewise, the median hourly wage for workers of differing educational attainments dropped as well. Workers with a high school education and workers with a bachelor’s degree or higher both saw their typical hourly wage fall by just over 5 percent, while workers with some college experience or an associate’s degree experienced a drop of more than 9 percent. In short, the typical New Hampshire worker’s ability to purchase the same level of goods and services today as he or she did eight years ago has diminished.
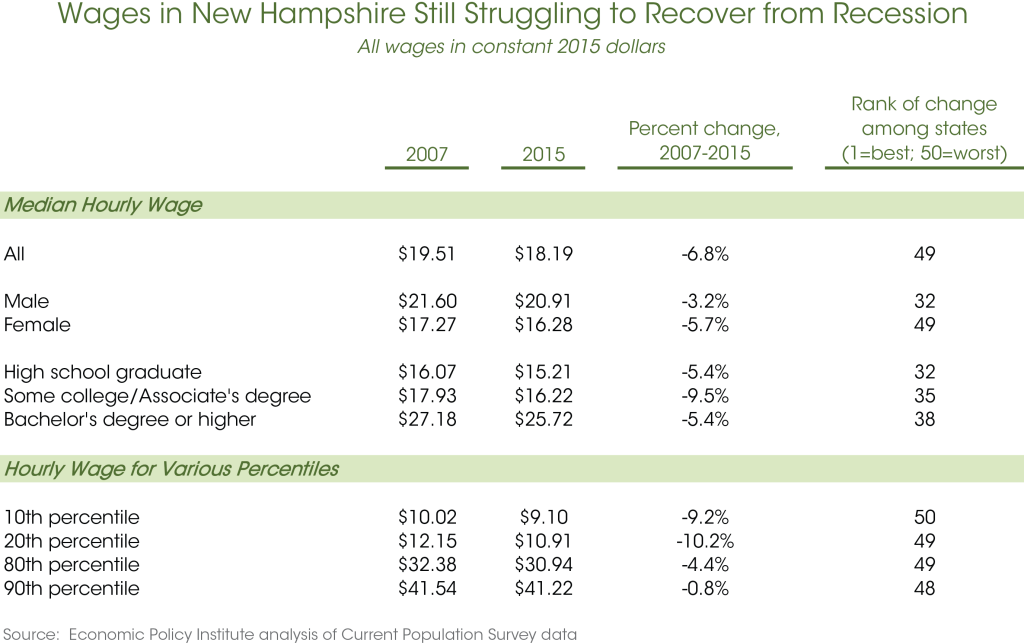
Finally, while the decline in hourly wages seems to have occurred throughout the wage distribution in New Hampshire, low-wage workers appear to have suffered larger drops than their higher-paid counterparts. For example, in 2007, a worker at the 20th percentile of the wage distribution in New Hampshire – that is, someone representing the cutoff between the bottom fifth of all workers and everyone else – was paid $12.15 per hour. By 2015, a worker at the same position in the wage distribution was paid just $10.91 per hour, a difference of 10.2 percent. Over the same period, a worker at the 80th percentile – the cutoff point between the best-paid fifth of workers and the rest of the distribution – saw his or her hourly wage fall from $32.38 to $30.94, a drop of just about 4.4 percent.
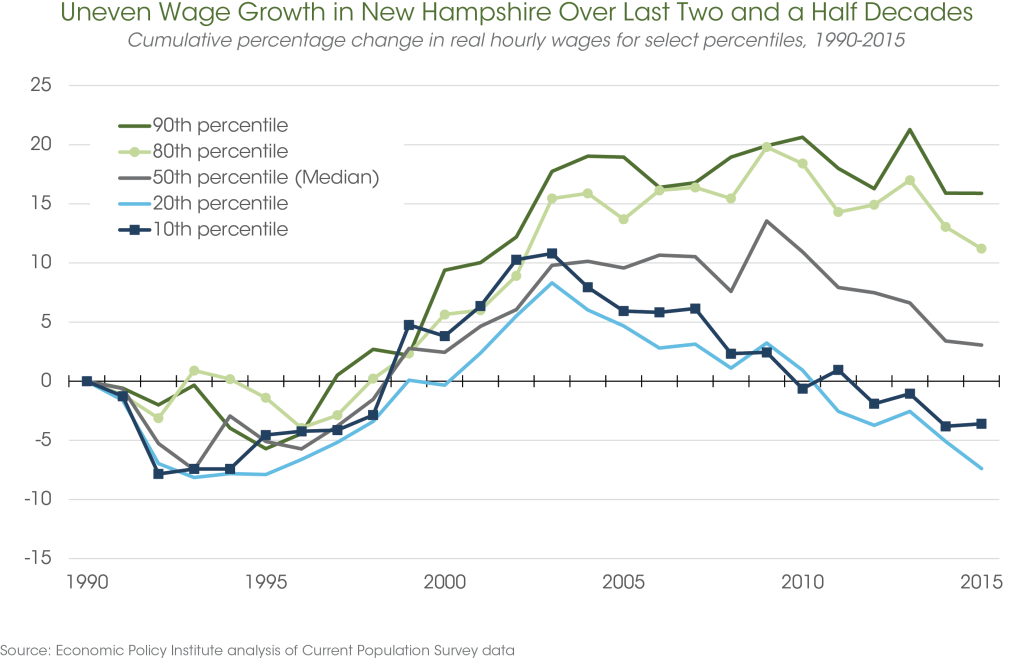
The uneven experience of low- and high-wage New Hampshire workers since 2007 to some degree marks the continuation of a much longer-term trend. As the graph above illustrates, workers near the top of New Hampshire’s wage distribution have fared much better over the last two and a half decades than either workers at the middle of the wage distribution or workers on its lowest rungs. More specifically, after adjusting for inflation, the hourly wage for a worker at the 80th percentile of the New Hampshire wage distribution has grown 11 percent overall since 1990, rising from $27.82 to $30.94; gains for workers at the 90th percentile have been even larger. In contrast, the hourly wage for a worker at the 20th percentile was $11.78 in 1990 and is just $10.91 today, a difference equal to negative 7.4 percent overall.
Poverty Still Lower in New Hampshire than Most States, but Higher than it Used To Be
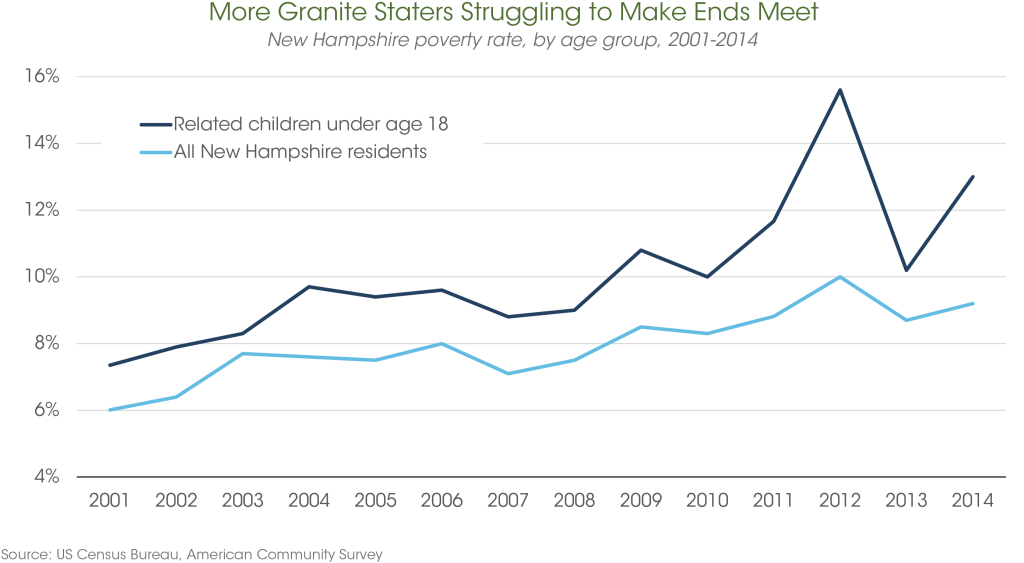
At the very least, the preceding discussion suggests that many Granite Staters may not be sharing in the benefits of the state’s growing economy. Data on the number and share of New Hampshire residents living in poverty point to a similar conclusion. According to the US Census Bureau, roughly 118,000 Granite Staters or 9 percent of all New Hampshire residents lived in households with incomes below the federal poverty level in 2014. (For context, the federal poverty level for a household composed of two adults and one child is $19,055.) While New Hampshire’s share of residents living in poverty is the lowest in the nation, the issue of households not earning enough for basic needs has steadily become more pervasive over time. In 2001, the share of New Hampshire residents with incomes below the federal poverty line stood at 6.0 percent. By 2007, it had climbed to 7.1 percent, and by 2014, the most recent year for which such data are available, it had reached 9.2 percent. The same is true, albeit to a greater degree, for children living in the Granite State. The child poverty rate was 13.0 percent in 2014, well above the 2001 level of 7.4 percent.
Moreover, as NHFPI has sought to explain previously, the official poverty threshold likely understates the degree of economic insecurity in New Hampshire and elsewhere, since a family of three is considered “not poor” if it earns a collective annual income of $20,000.[xi] This figure intuitively feels low given prices for housing, food, health care, childcare, and transportation. In fact, by one estimate, the income a family of three needs to get by in New Hampshire is around three times the official federal poverty level.[xii] If this is true and already 9 percent of residents are poor by official federal measures, then the actual percentage of people who are struggling to attain an adequate standard of living is likely much higher.
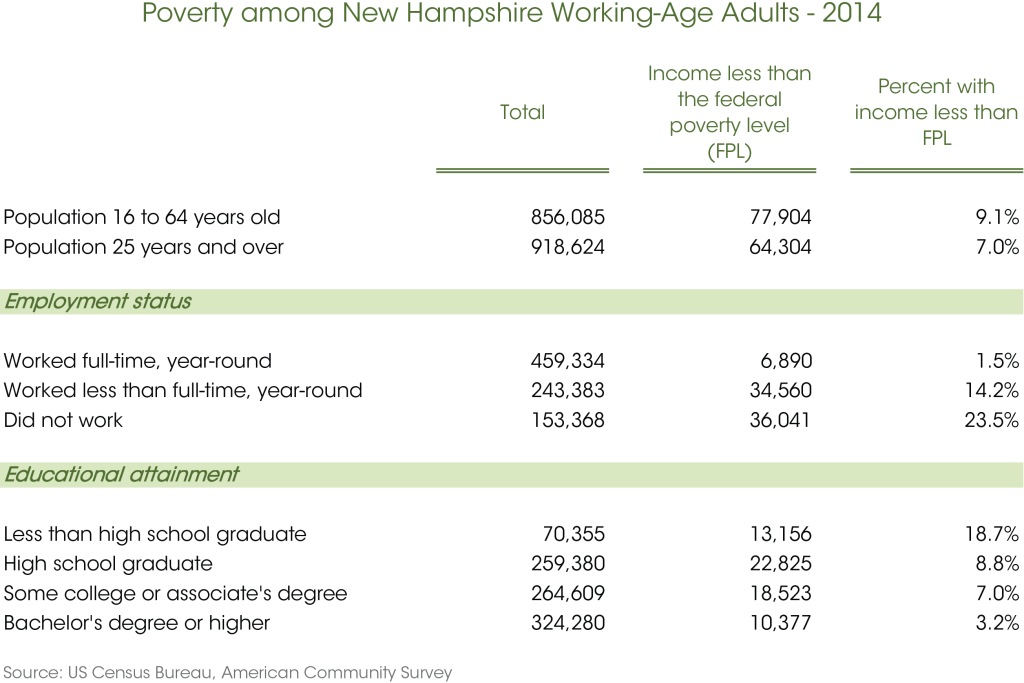
Not surprisingly, individuals who are employed full-time or who hold a bachelor’s degree or higher tend to have lower poverty rates than the population as a whole in New Hampshire. Nevertheless, of the roughly 77,900 working age adults living in poverty in 2014, 41,450 – or about 54 percent – were employed in some fashion that year. Similarly, about one-third of working-age New Hampshire adults living in poverty in 2014 – or about 28,900 individuals – had attended college at some point in their lives. Consequently, while policymakers would do well to look toward public policies designed to improve human capital, to permit workers to engage in the labor force more readily, and to bolster employment, they should remain aware that some jobs simply may not pay enough on their own to lift workers and their families out of poverty.
Conclusion
By several key measures, New Hampshire’s economy is on the upswing, as both employment and economic output have now surpassed where they were at the start of the Great Recession. Ultimately, though, a well-functioning economy should ensure that the workers contributing to it share in the gains they have helped to produce. From that perspective, the Granite State still has a way to go, since the income for the typical household and the wage for the typical worker has yet to recover from the downturn. Those households and workers – and the financial anxiety they face – should be the focus of policymakers’ efforts to shape the New Hampshire economy in the years ahead.
Endnotes
[i] http://www.bls.gov/lau/rdscnp16.htm#data
[ii] http://www.nhbr.com/June-26-2015/Mid-year-review-Labor-pains/
[iii] http://www.nhbr.com/December-25-2015/Annual-preview-Its-the-workforce-stupid/
[iv] http://www.nhes.nh.gov/elmi/statistics/documents/underutilization.pdf
[v] http://www.bls.gov/lau/stalt.htm
[vi] https://www.stlouisfed.org/Publications/Regional-Economist/January-2013/The-Feds-Latest-BalanceSheet-Policy-What-Constitutes-Substantial-LaborMarket-Improvement
[vii] See, for instance, “Jobs Return to Peak, but Quality Lags,” Wall Street Journal, June 9, 2014.
[viii] The source of the data used for this analysis is the Bureau of Labor Statistics’ Quarterly Census of Employment and Wages, one of the most reliable and comprehensive sources of industrial employment data. This analysis concludes with calendar year 2014 because 2015 data have not yet been released.
[ix] In calendar year 2001, the sum of all workers’ wages was around $21.6 billion. In 2014, that figure was approximately $32.1 billion. At first glance, one might assume this is a great development that collectively our paychecks have risen by nearly $11 billion. However, the problem with comparing money from two different points in time is that a dollar in 2001 could buy more than a dollar in 2014, due to the fact that most consumer prices rise over time. Therefore, in order to determine whether workers are earning enough money in 2014 to allow them to buy the same quantity of consumer items they could have in 2001, the data needs to be adjusted for inflation. Accordingly, this Issue Brief uses the Consumer Price Index Research Series Using Current Methods (CPI-U-RS) to present data on gross state product, aggregate wages, and median household in 2014 dollars.
[x] See, for instance, Price, Mark and Sommeiller, Estelle, The Increasingly Unequal States of America: Income Inequality by State, 1917 to 2011, Economic Policy Institute, February 19, 2014.
[xi] https://www.nhfpi.org/research/state-economy/taking-the-measure-of-need-granite-state.html